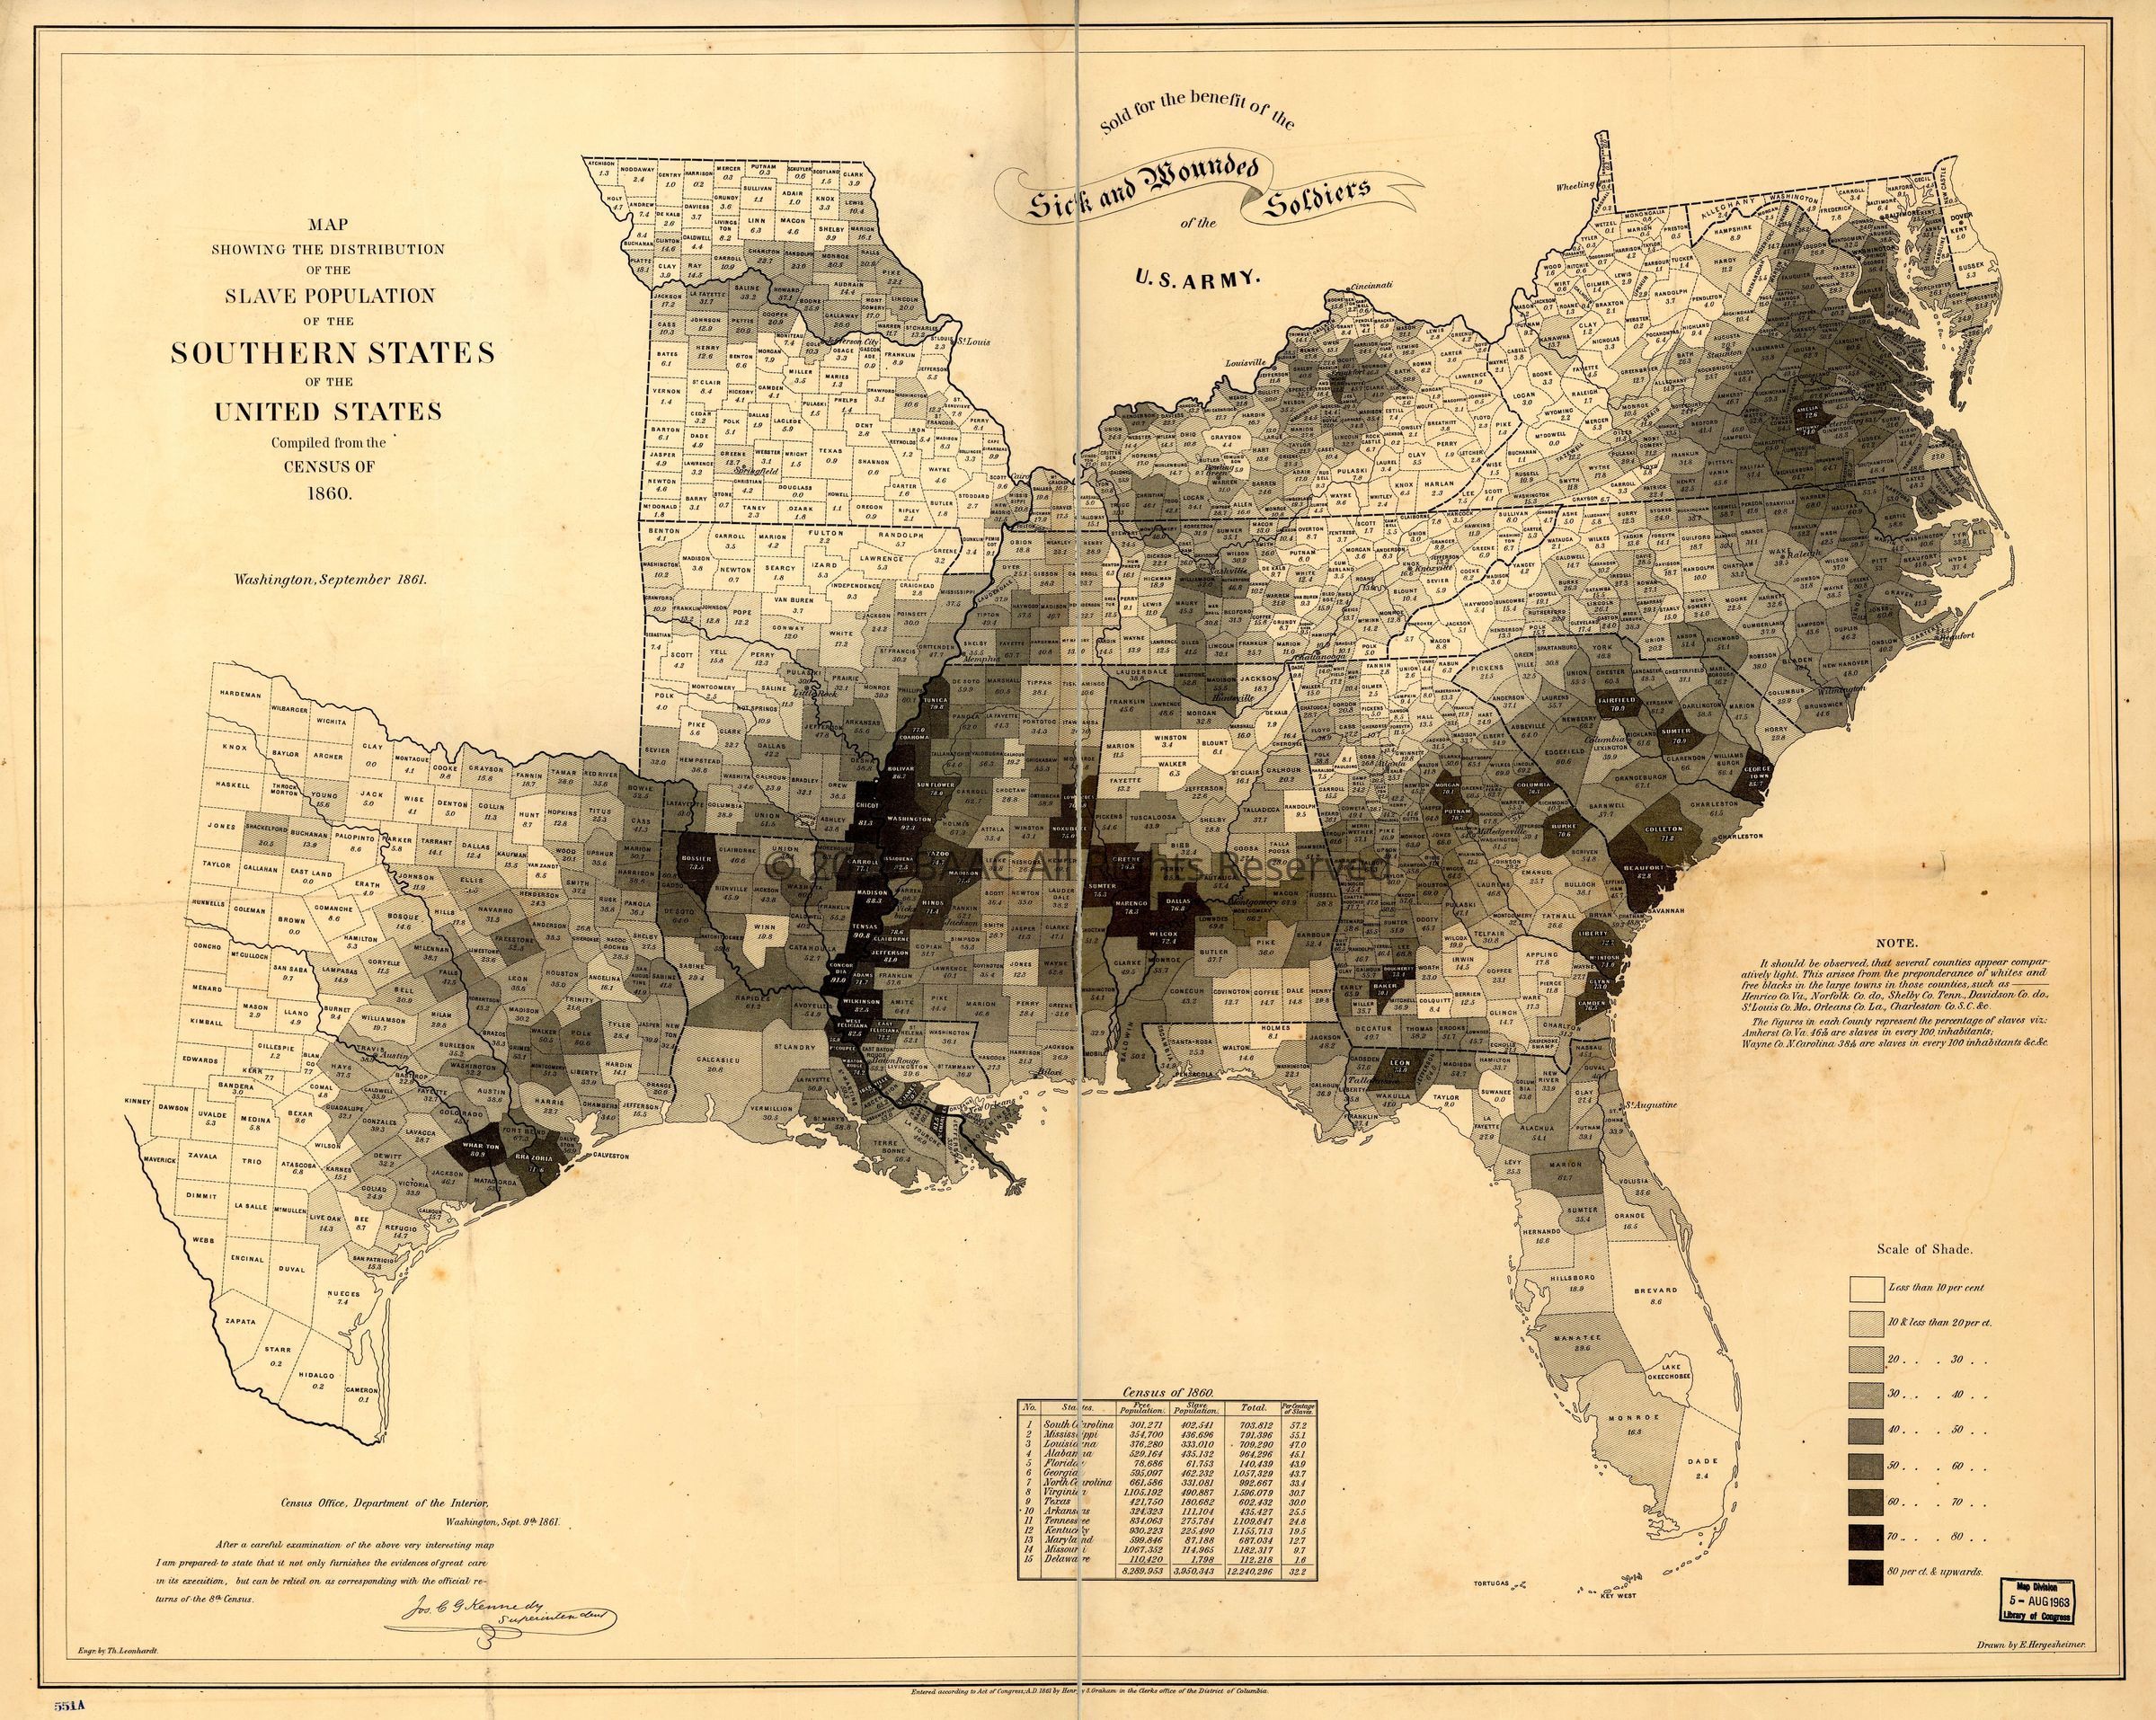
Map Showing the Distribution of the Slave Population of the Southern States of the United States compiled from the Census of 1860 by Edwin Hergesheimer - "Entered according to Act of Congress, A.D. 1861 by Henry S. Graham." - "Sold for the benefit of the sick and wounded soldiers of the U.S. Army." - "Census Office, Department of the Interior, Washington, Sept. 9th, 1861. After a careful examination of the above very interesting map I am prepared to state that it not only furnishes the evidences of great care in its execution, but can be relied on as corresponding with the official returns of the 8th Census. [Signed in facsimile] Jos. C. G. Kennedy, Superintendent." - Map indicates by shading in black and white the percentage of slaves in each county. "It should be observed, that several counties appear comparatively light. This arises from the preponderance of whites and free blacks in the large towns in those counties. . . The figures in each county represent the percentage of slaves. . ." - "Scale of shade" printed in lower right corner. - Includes population table based on census of 1860.
(Researcher's note: see article at https://archive.nytimes.com/opinionator.blogs.nytimes.com/2010/12/09/visualizing-slavery/)
Date(s) of Creation
9/9/1861
Other Names and Numbers
Other Names
Name Type
Enslaved
Other Name
Unidentified Slaves
Name Type
Enslaver
Other Name
Not named
Other Numbers
Number Type
Source Citation
Other Number
Hergesheimer, Edwin (1861) Map showing the distribution of the slave population of the southern states of the United States Compiled from the census of. Washington Henry S. Graham. [Map] Retrieved from the Library of Congress, Control Number 99447026