Name/Title
S02.08.006Description
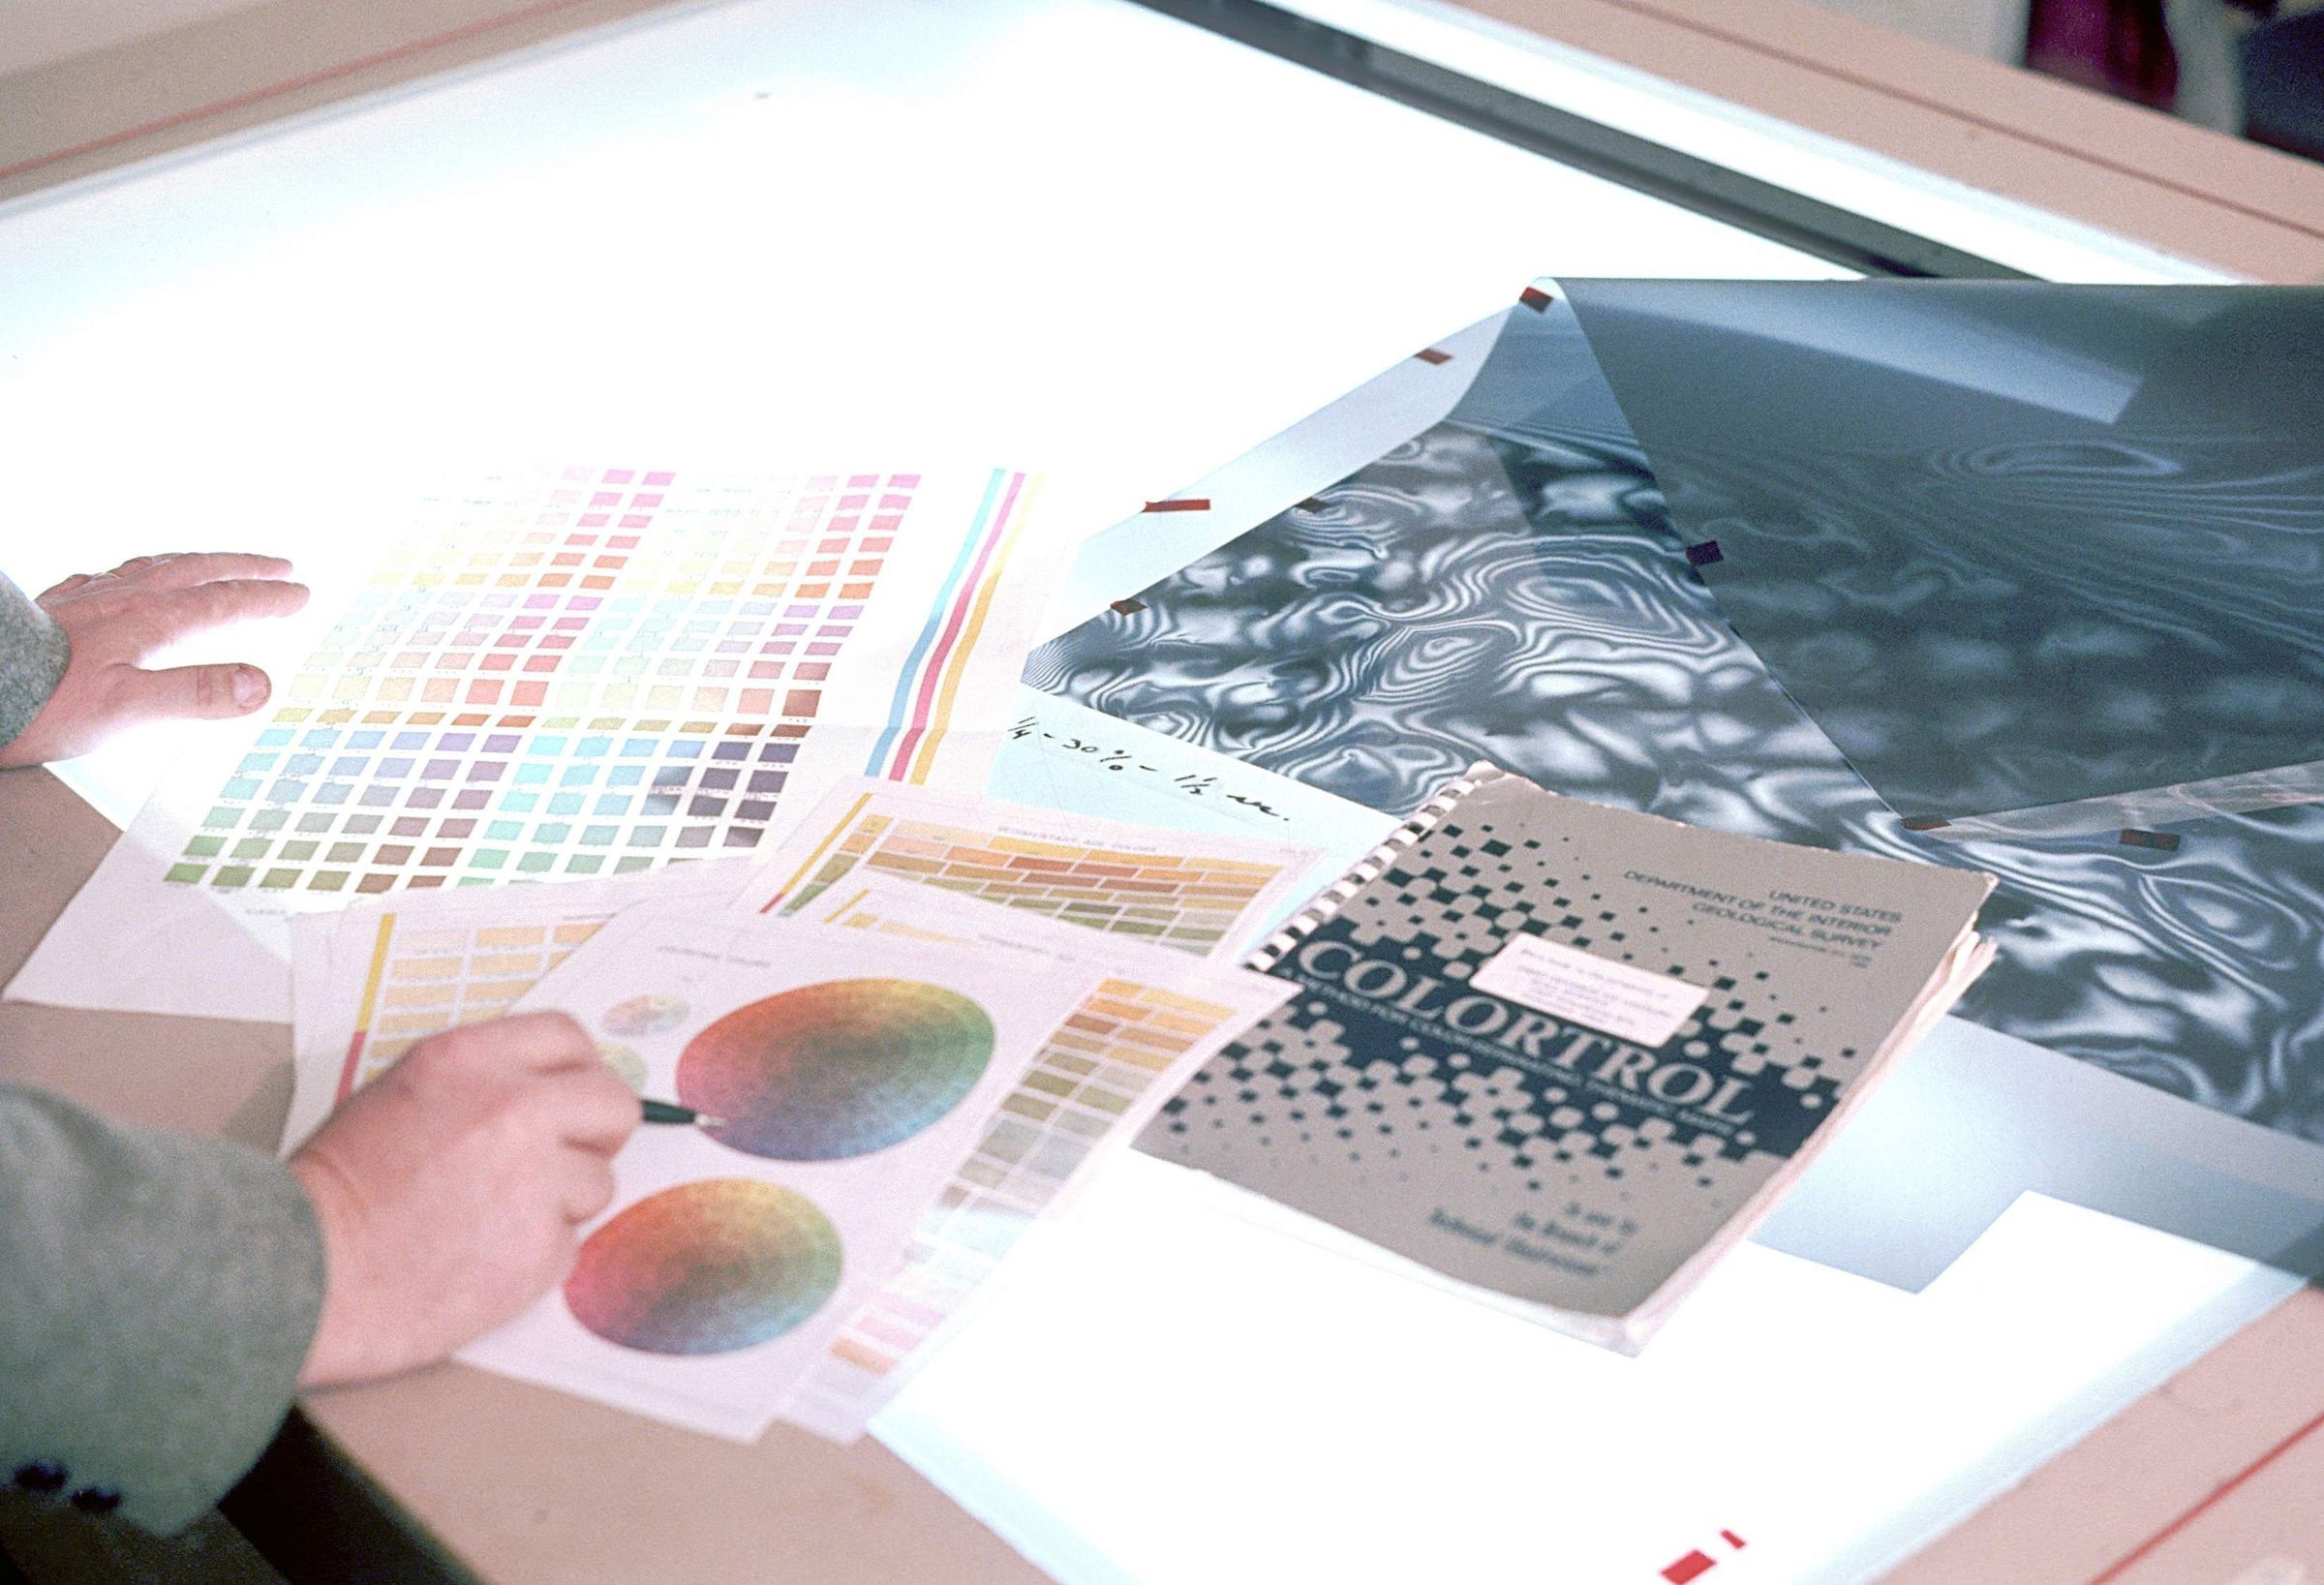
The tools used in the process of deciding and creating the colors for a map are spread across the light table. It was typical to keep colors aligned with United States Geological Survey standards. Cartographers would pick colors to represent each different geologic area on a map and any other colored areas (for example, waterways). The color would have a CMYK formula (CMYK represents Cyan, Magenta, Yellow, and Black). For example, 30 percent cyan and 50 percent yellow would produce a green color. This image shows a negative on the light table that is actually a dot screen. The percentage of dots on the screen produces the percentage of one of the four colors of the CMYK process. Following the example given above, to obtain 30 percent cyan the cartographer would use a 30 percent screen when making the final cyan plate and a 50 percent screen to make the final yellow plate. The work would be done in the Publications Section of the Ohio Geological Survey. The Ohio Department of Natural Resources, Division of Geological Survey's main office was located at 1207 Grandview Avenue, Grandview Heights, Ohio 43212 from 1962 through May 1973. The Image was taken in 1971.
This slide image included in the USGS National Digital Catalog for NGGDPP Grant G15AP00115 in FY2015.Context
Color pallettes and topography maps laid out on a lightbox table.Taken at the office in Grandview Heights, Ohio.